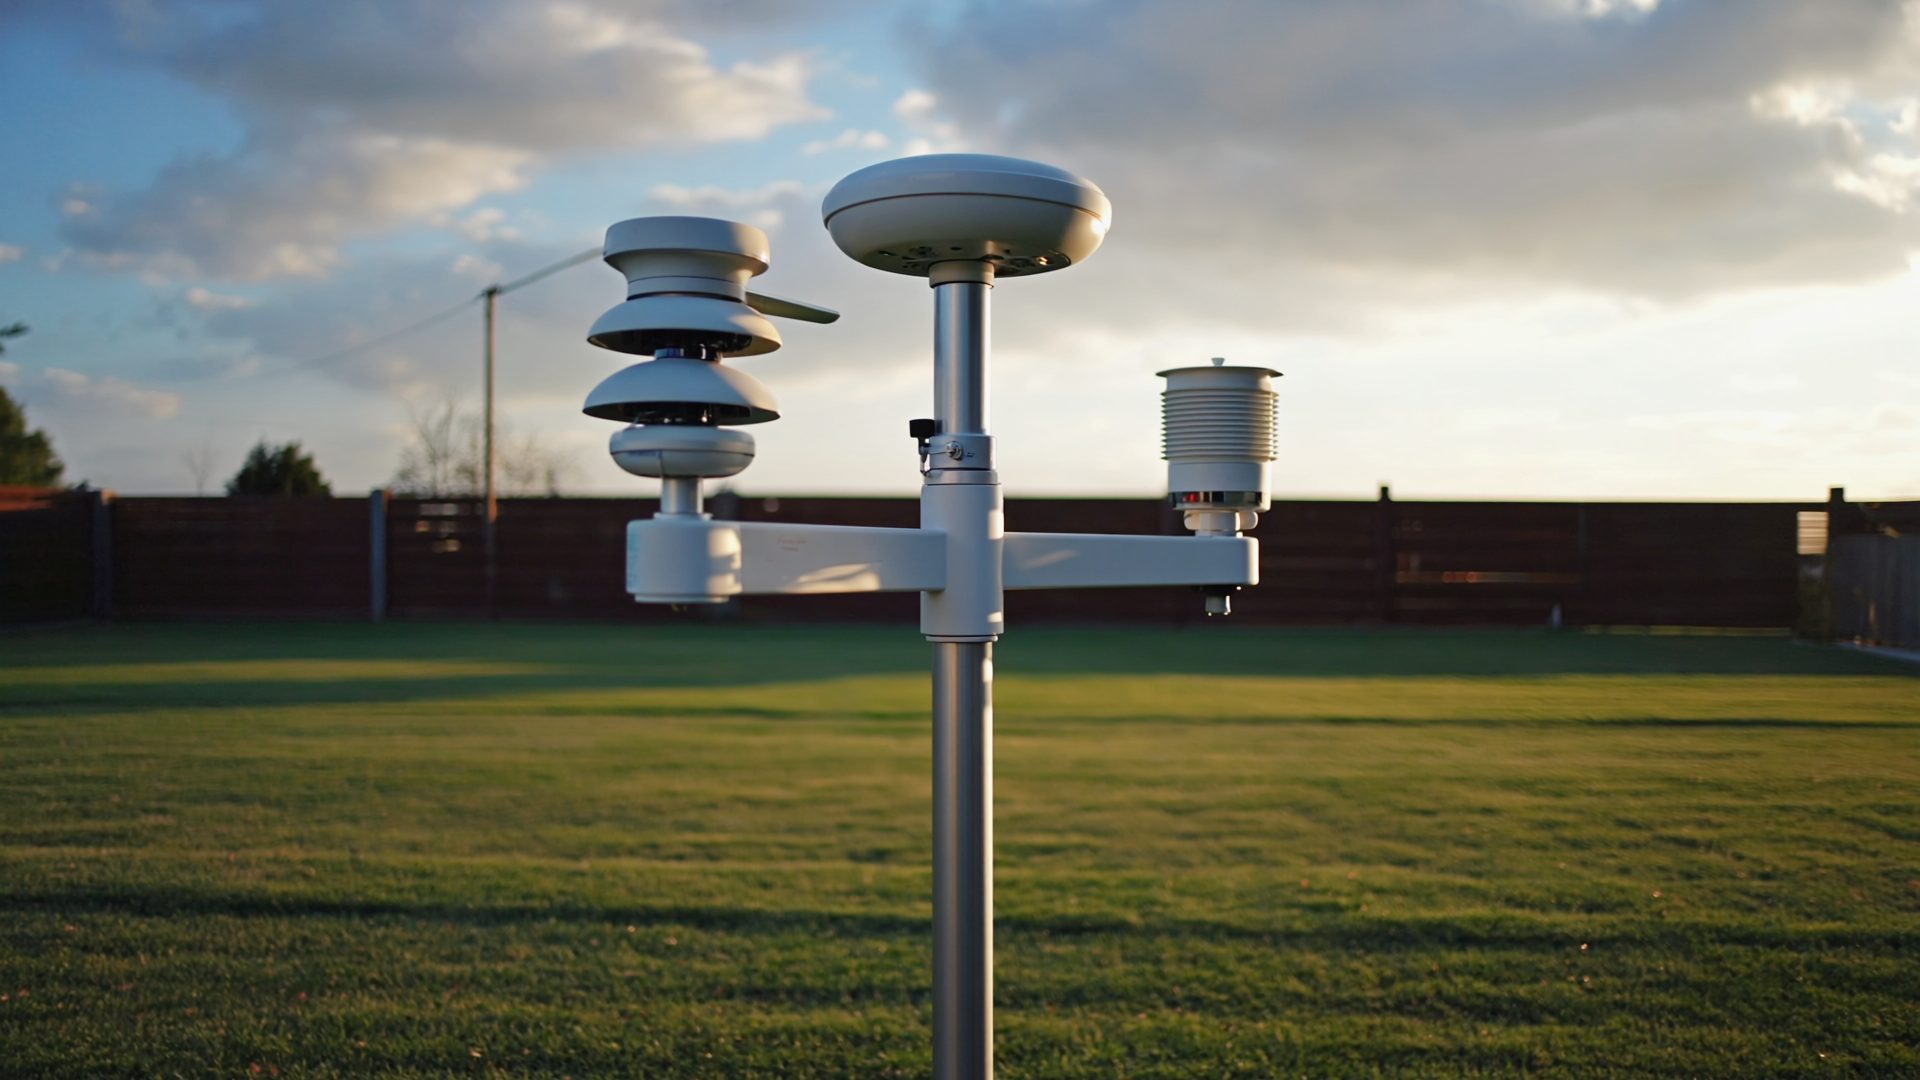
You set up your weather station, and now your console shows a wall of numbers: temperature, humidity, barometric pressure, dew point, wind chill, heat index, UV index, rain rate. What does it all mean, and how do you use it? If you have not set up your station yet, start with our complete weather station installation guide. This guide explains each reading in plain language with Gulf Coast context.
Temperature
The most basic reading and the one most people check first. Your station reports the current air temperature at the sensor location. Key things to know:
- Sensor placement matters enormously. A sensor in direct sun can read 10–15°F high. A sensor near a concrete patio absorbs radiated heat. Your reading is only as good as your placement (see our setup guide).
- Your reading may differ from the airport. Official NWS temperatures come from ASOS stations at airports, which follow strict WMO siting standards. Your backyard temperature is valid for your location, which may be warmer or cooler than the airport due to urban heat islands, tree cover, or proximity to water.
- Daily high and low: Most stations log these automatically. On the Gulf Coast, the daily high typically occurs around 3–5 PM and the low at sunrise.
Relative Humidity
Relative humidity (RH) measures what percentage of its maximum moisture capacity the air currently holds. At 100% RH, the air is saturated and can hold no more water vapor — fog, dew, or rain results.
On the Gulf Coast, humidity is always high. Summer RH regularly sits at 70–90% during daytime and hits 100% overnight. This is normal. What to watch for:
- Rapid drops in humidity (20%+ in a few hours) during spring or fall can signal a dry cold front passage, which often brings severe weather before the humidity drops.
- Indoor humidity above 60% promotes mold growth. During extended power outages without AC, indoor humidity can spike dangerously — open windows for airflow when possible.
- Humidity below 30% is rare on the Gulf Coast but happens during winter cold fronts. It increases static electricity and dry skin but also reduces mold and mildew activity.
Dew Point
Dew point is the temperature at which the air would become saturated (100% RH). It is a better indicator of comfort than relative humidity because it does not change with temperature throughout the day. Here is the comfort scale:
| Dew Point | Comfort Level | Gulf Coast Context |
|---|---|---|
| Below 55°F | Comfortable, dry | Winter cold fronts, rare in summer |
| 55–65°F | Pleasant, slightly humid | Spring/fall, brief windows in summer |
| 65–70°F | Noticeable humidity | Common spring/fall |
| 70–75°F | Oppressive | Typical summer |
| Above 75°F | Miserable, tropical | Peak summer, especially near coast |
When your station shows a dew point above 70°F, outdoor activity becomes genuinely difficult. Your sweat does not evaporate efficiently, and heat illness risk increases. This is standard Gulf Coast summer — plan outdoor work for early morning or evening.
Barometric Pressure
Barometric pressure (measured in inches of mercury, inHg, or millibars, mb) is the weight of the atmosphere above you. Standard sea-level pressure is 29.92 inHg (1013.25 mb). Your station should be calibrated to report sea-level pressure (adjusted for your elevation) so readings are comparable to official forecasts.
Pressure trends are more useful than absolute values:
- Falling pressure: Approaching storm system or low pressure. If pressure drops more than 0.06 inHg per hour, significant weather is likely within 12–24 hours.
- Rising pressure: Clearing weather, high pressure moving in. Post-frontal conditions.
- Steady pressure: Current conditions likely to persist.
- Rapid drop below 29.50 inHg: Strong storm nearby. During a major hurricane, pressure can drop below 28.00 inHg near the eye.
We cover this in depth in our barometer reading guide.
Wind Speed and Direction
Wind speed is typically reported as sustained (average over 2 minutes) and gust (highest 3-second reading). On the Gulf Coast, pay attention to:
- Summer sea breezes: Onshore winds from the south/southeast develop most afternoons, providing slight cooling and triggering afternoon thunderstorms inland.
- Cold front passages: Wind shifts from south/southwest to north/northwest, often with a sudden gust.
- Hurricane-force gusts: Sustained winds of 74+ mph with gusts 20–30% higher. If your station survives to report these, your anemometer is performing admirably.
Wind direction is reported as the direction the wind is coming FROM. A "south wind" blows from south to north. On weather station displays, direction is often shown as degrees (180° = south).
Heat Index
Heat index combines temperature and humidity into a "feels like" temperature. On the Gulf Coast, this is the most practically important reading during summer:
- Below 90°F: Caution zone, fatigue possible with prolonged activity
- 90–105°F: Danger zone, heat cramps and exhaustion likely with extended exposure
- 105–130°F: Extreme danger, heat stroke possible
- Above 130°F: Heat stroke imminent
In south Louisiana, summer heat index regularly exceeds 110°F. This is why the NWS issues heat advisories frequently for the region. Your weather station makes this hyperlocal — conditions in your shaded backyard may be 5–10°F lower than an exposed parking lot nearby.
UV Index
Measures the strength of UV radiation reaching the ground. Scale of 0–11+. Gulf Coast summer readings routinely hit 10–11 (extreme). At UV 8+, unprotected skin burns in under 15 minutes. Useful for planning outdoor time and protecting children.
Rain Rate and Accumulation
Rain rate is current rainfall intensity, reported in inches per hour. Light rain is under 0.1 in/hr, moderate is 0.1–0.3 in/hr, heavy is above 0.3 in/hr. Gulf Coast thunderstorms regularly produce rates above 2 in/hr and can briefly exceed 4 in/hr during tropical downpours.
Rain accumulation tracks daily, weekly, monthly, and yearly totals. Comparing your station's totals against official records and neighbors' stations (on Weather Underground) helps validate your gauge's accuracy and reveals hyperlocal rainfall variations.
Solar Radiation
Measured in watts per square meter (W/m²), solar radiation tells you how much energy the sun is delivering. Clear summer noon in Louisiana: 900–1,000 W/m². Overcast: 100–300 W/m². Useful for solar panel owners, gardeners, and anyone monitoring energy balance.
Recommended Weather Stations for Beginners
- Ambient Weather WS-2902 — Best starter station with all key readings ($170–$200)
- La Crosse C83100 — Budget station with basic data ($90–$120)
- Ambient Weather WS-5000 — Upgrade pick with ultrasonic sensors ($330–$380)
★ Recommended Reading & Gear
- The Weather Machine — How forecasting works and why your backyard data matters to the global weather network
- Weather Station Handbook — Classic reference guide for siting, calibrating, and interpreting personal weather station readings
- Ambient Weather WS-2902 — Best beginner station with all readings covered in this guide ($170–$200)
Bottom Line
Start with three readings: temperature (is it hot?), dew point (is it humid?), and barometric pressure trend (is weather changing?). These three numbers tell you more about what is happening and what is coming than any weather app. As you get comfortable, add wind, rain rate, and UV index to your daily monitoring. Within a month, you will be reading your backyard weather like a local forecaster.
Frequently Asked Questions
What is the most important weather station reading to monitor?
For daily comfort and safety, dew point is the most useful single reading because it directly indicates how humid and uncomfortable the air feels, and unlike relative humidity, it does not fluctuate with temperature changes throughout the day. For storm tracking, barometric pressure trend is most important -- a rapid drop signals approaching severe weather.
Why does my weather station temperature differ from the official forecast?
Official NWS temperatures come from ASOS stations at airports that follow strict WMO siting standards. Your backyard conditions differ due to microclimates -- urban heat islands, tree cover, elevation differences, and proximity to water all affect readings. Your station's temperature is accurate for your specific location.
How often should I calibrate my weather station?
Check calibration every 3-6 months by comparing your readings against a nearby ASOS or AWOS station during stable weather conditions. Temperature sensors rarely drift, but barometric pressure may need occasional adjustment. Rain gauges should be checked for debris monthly, and humidity sensors should be replaced every 2-3 years as they degrade.
What does a high dew point mean on my weather station?
A dew point above 65 degrees F means the air holds significant moisture, making it feel humid. Above 70 degrees F is considered oppressive -- sweat does not evaporate efficiently, increasing heat illness risk. On the Gulf Coast, summer dew points regularly reach 75 degrees F or higher, which is why heat index values often exceed 110 degrees F even when the actual temperature is in the low 90s.
Can a home weather station help predict storms?
Yes. A falling barometric pressure trend is the most reliable home-level storm predictor. A drop of more than 0.06 inHg per hour signals significant weather within 12-24 hours. Combined with rising humidity and shifting wind direction, your weather station can give you advance warning of approaching fronts, thunderstorms, and tropical systems before official alerts are issued.
Explore More on AI Leapers
- Best Kids Outdoor Toys 2026 on KidGearPro
- Best Air Purifiers for Home Office on DeskSetupPro
- Best Cooling Sheets for Summer on RestWell